
Zonal#
Xarray-spatial’s zonal functions provide an easy way to generate statistics for zones within a raster aggregate. It’s set up with a default set of calculations, or you can input any set of custom calculations you’d like to perform.
Importing Packages#
[1]:
import numpy as np
import pandas as pd
import xarray as xr
[2]:
import matplotlib.pyplot as plt
from matplotlib.colors import LinearSegmentedColormap
import numpy as np

def _shade(arr, cmap=None, alpha=None, min_alpha=None, span=None, how='linear'):
    arr = np.asarray(arr, dtype=np.float64)
    finite = np.isfinite(arr)
    if span is not None:
        lo, hi = span
    elif finite.any():
        lo = np.nanmin(arr); hi = np.nanmax(arr)
    else:
        lo = hi = 0.0
    norm = np.zeros_like(arr, dtype=np.float32)
    if hi > lo:
        norm = np.where(finite, (arr - lo) / (hi - lo), 0.0).astype(np.float32)
    if isinstance(cmap, (list, tuple)):
        cmap = LinearSegmentedColormap.from_list('c', list(cmap), N=256)
    elif cmap is None:
        cmap = plt.get_cmap('terrain')
    rgba = cmap(norm, bytes=True)
    a = np.where(finite, 255 if alpha is None else alpha, 0).astype(np.uint8)
    if min_alpha is not None:
        a = np.where(finite & (a < min_alpha), min_alpha, a).astype(np.uint8)
    rgba[..., 3] = a
    return rgba

def _stack(*layers):
    base = layers[0].astype(np.float64)
    for top in layers[1:]:
        a = (top[..., 3:4] / 255.0)
        rgb = top[..., :3] * a + base[..., :3] * (1 - a)
        out_a = np.maximum(top[..., 3], base[..., 3])
        base = np.concatenate([rgb, out_a[..., None]], axis=-1)
    return np.clip(base, 0, 255).astype(np.uint8)

def _show(rgba, bg=None, figsize=(8, 6)):
    plt.figure(figsize=figsize)
    plt.imshow(rgba)
    plt.axis('off')
    plt.show()

Elevation = LinearSegmentedColormap.from_list(
    'elevation',
    [(0.0, (0.0, 0.3, 0.6)), (0.2, (0.2, 0.6, 0.85)), (0.3, (0.55, 0.78, 0.92)),
     (0.32, (0.4, 0.73, 0.45)), (0.45, (0.3, 0.55, 0.25)), (0.6, (0.5, 0.5, 0.3)),
     (0.75, (0.65, 0.55, 0.4)), (0.9, (0.8, 0.8, 0.78)), (1.0, (1.0, 1.0, 1.0))],
    N=256)
Set1 = plt.get_cmap('Set1')
Generate Terrain Data#
The rest of the geo-related functions focus on raster data or data that’s been aggregates into the row-column grid of cells for an image raster. To demonstrate using these raster-based functions, we’ll first use xarray-spatial’s generate_terrain to generate a fake elevation terrain raster. We use matplotlib’s Canvas as a quick base to set up a new raster.
[3]:
from xrspatial import generate_terrain

W = 800
H = 600

template_terrain = xr.DataArray(np.zeros((H, W)))
x_range = (-20e6, 20e6)
y_range = (-20e6, 20e6)

terrain = generate_terrain(template_terrain, x_range=x_range, y_range=y_range)

_show(_shade(terrain, cmap=["black", "white"], how="linear"))
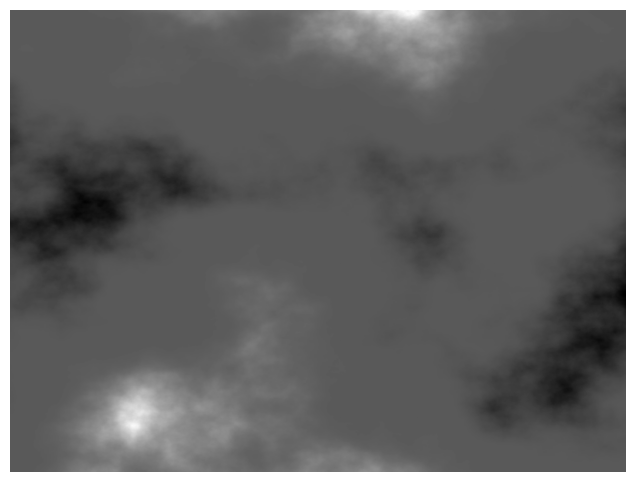
We can also apply matplotlib’s Elevation colormap imported above to give a more intuitive terrain image.
[4]:
_show(_shade(terrain, cmap=Elevation, how="linear"))

Zonal Statistics#
Zonal statistics calculates summary statistics for specific areas or zones within an xarray.DataArray aggregate. Specific zones within an aggregate are defined by creating a corresponding aggregate of the same shape and setting the value at each cell to a unique non-zero integer representing a unique zone id.
For example, if we set all the values in the top row of the zones aggregate to 3 and apply this to the original values aggregate, zonal stats will calculate statisitics for all the values in the corresponding top row of the values aggregate and return the results as stats for zone #3.
The output of zonal stats is in the form of a pandas DataFrame, with a row for each zone.
Let’s set up an example.
Imagine you go on a six-day hike.
We can represent the area with a terrain raster.
In that terrain, we can represent each day’s path as a line segment from your start to finish point.
We can set this up with a pandas dataframe containing the start and finish points, which we then aggregate with Canvas.line.
Let’s take a look at these line zones overlayed on the fake terrain.
[5]:
from xrspatial import hillshade
import geopandas as gpd
from shapely.geometry import LineString

terrain_shaded = _shade(terrain, cmap=Elevation, alpha=128, how="linear")

illuminated = hillshade(terrain)
illuminated_shaded = _shade(illuminated, cmap=["gray", "white"], alpha=255, how="linear")

zone_df = pd.DataFrame(
    {
        "x": [-11, -5, 4, 12, 14, 18, 19],
        "y": [-5, 4, 10, 13, 13, 13, 10],
        "trail_segement_id": [11, 12, 13, 14, 15, 16, 17],
    }
)

# Rasterize the trail line onto the terrain grid with the .xrs accessor
# (replaces ds.Canvas().line(..., agg=ds.sum('trail_segement_id'))).
xs = np.linspace(x_range[0], x_range[1], W)
ys = np.linspace(y_range[1], y_range[0], H)
template = xr.DataArray(np.full((H, W), np.nan),
                        coords={'y': ys, 'x': xs}, dims=['y', 'x'])
zone_gdf = gpd.GeoDataFrame(
    {'trail_segement_id': zone_df['trail_segement_id'].values},
    geometry=[LineString(zip(zone_df['x'], zone_df['y']))],
    crs='EPSG:4326',
)
zones_agg = template.xrs.rasterize(zone_gdf, column='trail_segement_id',
                                  merge='sum')
zones_shaded = _shade(zones_agg, cmap=Set1, min_alpha=255)

_show(_stack(illuminated_shaded, terrain_shaded, zones_shaded))
---------------------------------------------------------------------------
ValueError                                Traceback (most recent call last)
Cell In[5], line 24
     20 xs = np.linspace(x_range[0], x_range[1], W)
     21 ys = np.linspace(y_range[1], y_range[0], H)
     22 template = xr.DataArray(np.full((H, W), np.nan),
     23                         coords={'y': ys, 'x': xs}, dims=['y', 'x'])
---> 24 zone_gdf = gpd.GeoDataFrame(
     25     {'trail_segement_id': zone_df['trail_segement_id'].values},
     26     geometry=[LineString(zip(zone_df['x'], zone_df['y']))],
     27     crs='EPSG:4326',

File ~/checkouts/readthedocs.org/user_builds/xarray-spatial/envs/stable/lib/python3.12/site-packages/geopandas/geodataframe.py:246, in GeoDataFrame.__init__(self, data, geometry, crs, *args, **kwargs)
    238     if isinstance(geometry, pd.Series) and geometry.name not in (
    239         "geometry",
    240         None,
    241     ):
    242         # __init__ always creates geometry col named "geometry"
    243         # rename as `set_geometry` respects the given series name
    244         geometry = geometry.rename("geometry")
--> 246     self.set_geometry(geometry, inplace=True, crs=crs)
    248 if geometry is None and crs:
    249     raise ValueError(
    250         "Assigning CRS to a GeoDataFrame without a geometry column is not "
    251         "supported. Supply geometry using the 'geometry=' keyword argument, "
    252         "or by providing a DataFrame with column name 'geometry'",
    253     )

File ~/checkouts/readthedocs.org/user_builds/xarray-spatial/envs/stable/lib/python3.12/site-packages/geopandas/geodataframe.py:482, in GeoDataFrame.set_geometry(self, col, drop, inplace, crs)
    476 if isinstance(frame.columns, pd.MultiIndex) and not isinstance(
    477     geo_column_name, tuple
    478 ):
    479     # when setting a single column to dataframe with multi-index columns,
    480     # pandas does not like setting it with only the first level name
    481     geo_column_name = (geo_column_name,) + ("",) * (frame.columns.nlevels - 1)
--> 482 frame[geo_column_name] = level
    484 if not inplace:
    485     return frame

File ~/checkouts/readthedocs.org/user_builds/xarray-spatial/envs/stable/lib/python3.12/site-packages/geopandas/geodataframe.py:2011, in GeoDataFrame.__setitem__(self, key, value)
   2009         if key == "geometry":
   2010             self._persist_old_default_geometry_colname()
-> 2011 super().__setitem__(key, value)

File ~/checkouts/readthedocs.org/user_builds/xarray-spatial/envs/stable/lib/python3.12/site-packages/pandas/core/frame.py:4672, in DataFrame.__setitem__(self, key, value)
   4668             # Column to set is duplicated
   4669             self._setitem_array([key], value)
   4670         else:
   4671             # set column
-> 4672             self._set_item(key, value)

File ~/checkouts/readthedocs.org/user_builds/xarray-spatial/envs/stable/lib/python3.12/site-packages/pandas/core/frame.py:4874, in DataFrame._set_item(self, key, value)
   4870
   4871         Series/TimeSeries will be conformed to the DataFrames index to
   4872         ensure homogeneity.
   4873         """
-> 4874         value, refs = self._sanitize_column(value)
   4875
   4876         if (
   4877             key in self.columns

File ~/checkouts/readthedocs.org/user_builds/xarray-spatial/envs/stable/lib/python3.12/site-packages/pandas/core/frame.py:5756, in DataFrame._sanitize_column(self, value)
   5752                 value = Series(value)
   5753             return _reindex_for_setitem(value, self.index)
   5754
   5755         if is_list_like(value):
-> 5756             com.require_length_match(value, self.index)
   5757         return sanitize_array(value, self.index, copy=True, allow_2d=True), None

File ~/checkouts/readthedocs.org/user_builds/xarray-spatial/envs/stable/lib/python3.12/site-packages/pandas/core/common.py:601, in require_length_match(data, index)
    597 """
    598 Check the length of data matches the length of the index.
    599 """
    600 if len(data) != len(index):
--> 601     raise ValueError(
    602         "Length of values "
    603         f"({len(data)}) "
    604         "does not match length of index "
    605         f"({len(index)})"
    606     )

ValueError: Length of values (1) does not match length of index (7)
Now, we can apply zonal stats, after quickly correcting for nan values.
[6]:
from xrspatial import zonal_stats

zones_agg.values = np.nan_to_num(zones_agg.values, copy=False).astype(int)
zonal_stats(zones_agg, terrain)
---------------------------------------------------------------------------
NameError                                 Traceback (most recent call last)
Cell In[6], line 3
      1 from xrspatial import zonal_stats
      2
----> 3 zones_agg.values = np.nan_to_num(zones_agg.values, copy=False).astype(int)
      4 zonal_stats(zones_agg, terrain)

NameError: name 'zones_agg' is not defined
Calculate custom stats for each zone#
We can also put in our own set of stats calculations to perform instead of the default ones above.
We set up a dict with our desired functions and input that as the third argument to
zonal_stats.Below, we try out a range function and min and max functions.
[7]:
custom_stats = dict(
    elevation_change=lambda zone: zone.max() - zone.min(),
    elevation_min=np.min,
    elevation_max=np.max,
)

zonal_stats(zones=zones_agg, values=terrain, stats_funcs=custom_stats)
---------------------------------------------------------------------------
NameError                                 Traceback (most recent call last)
Cell In[7], line 7
      3     elevation_min=np.min,
      4     elevation_max=np.max,
      5 )
      6
----> 7 zonal_stats(zones=zones_agg, values=terrain, stats_funcs=custom_stats)

NameError: name 'zones_agg' is not defined
Here the zones are defined by line segments, but they can be any spatial pattern or, more specifically, any region computable as a Raster aggregate.