xrspatial.multispectral.ndvi#
- xrspatial.multispectral.ndvi(nir_agg: DataArray, red_agg: DataArray, name='ndvi')[source]#
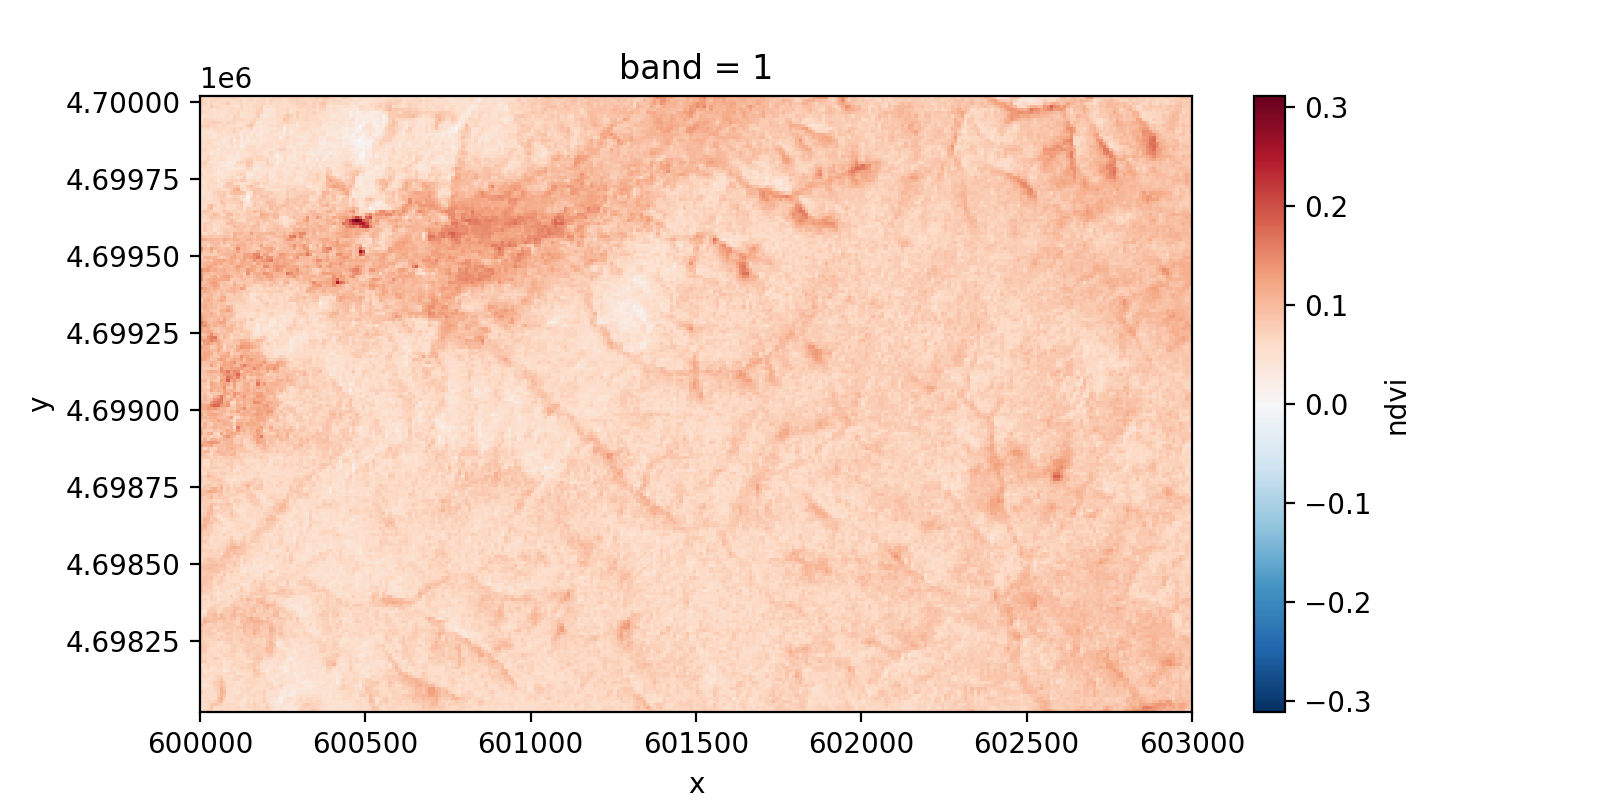
Computes Normalized Difference Vegetation Index (NDVI). Used to determine if a cell contains live green vegetation.
- Parameters:
nir_agg (xr.DataArray) – 2D array of near-infrared band data.
red_agg (xr.DataArray) – 2D array red band data.
name (str default='ndvi') – Name of output DataArray.
Alternatively
first (a single xr.Dataset may be passed as the)
Dataset (argument with keyword arguments mapping band names to)
example:: (variables. For) – ndvi(ds, nir=’B8’, red=’B4’)
- Returns:
ndvi_agg – 2D array of ndvi values. All other input attributes are preserved.
- Return type:
xarray.DataArray of same type as inputs
References
Chris Holden: http://ceholden.github.io/open-geo-tutorial/python/chapter_2_indices.html # noqa
Examples
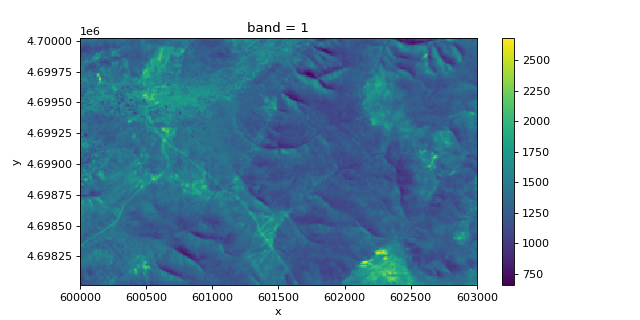
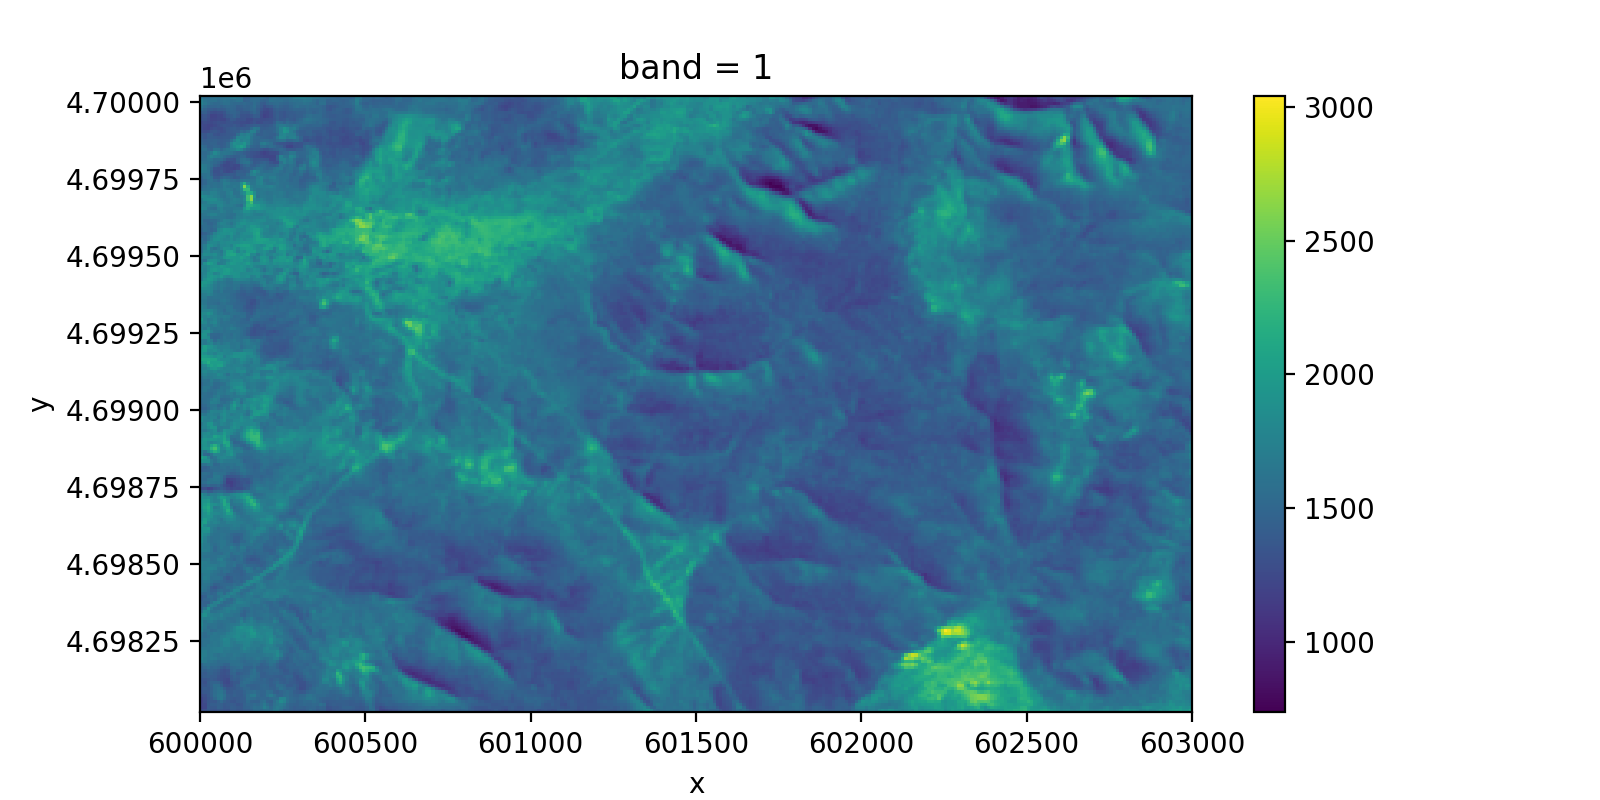
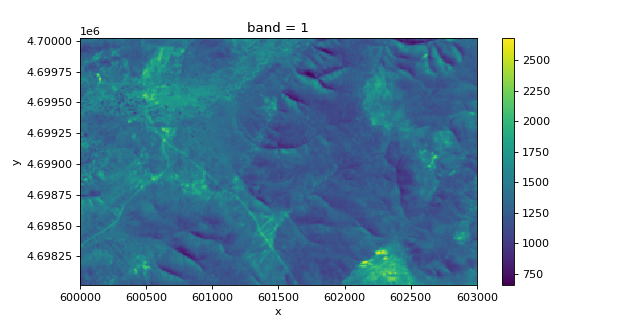
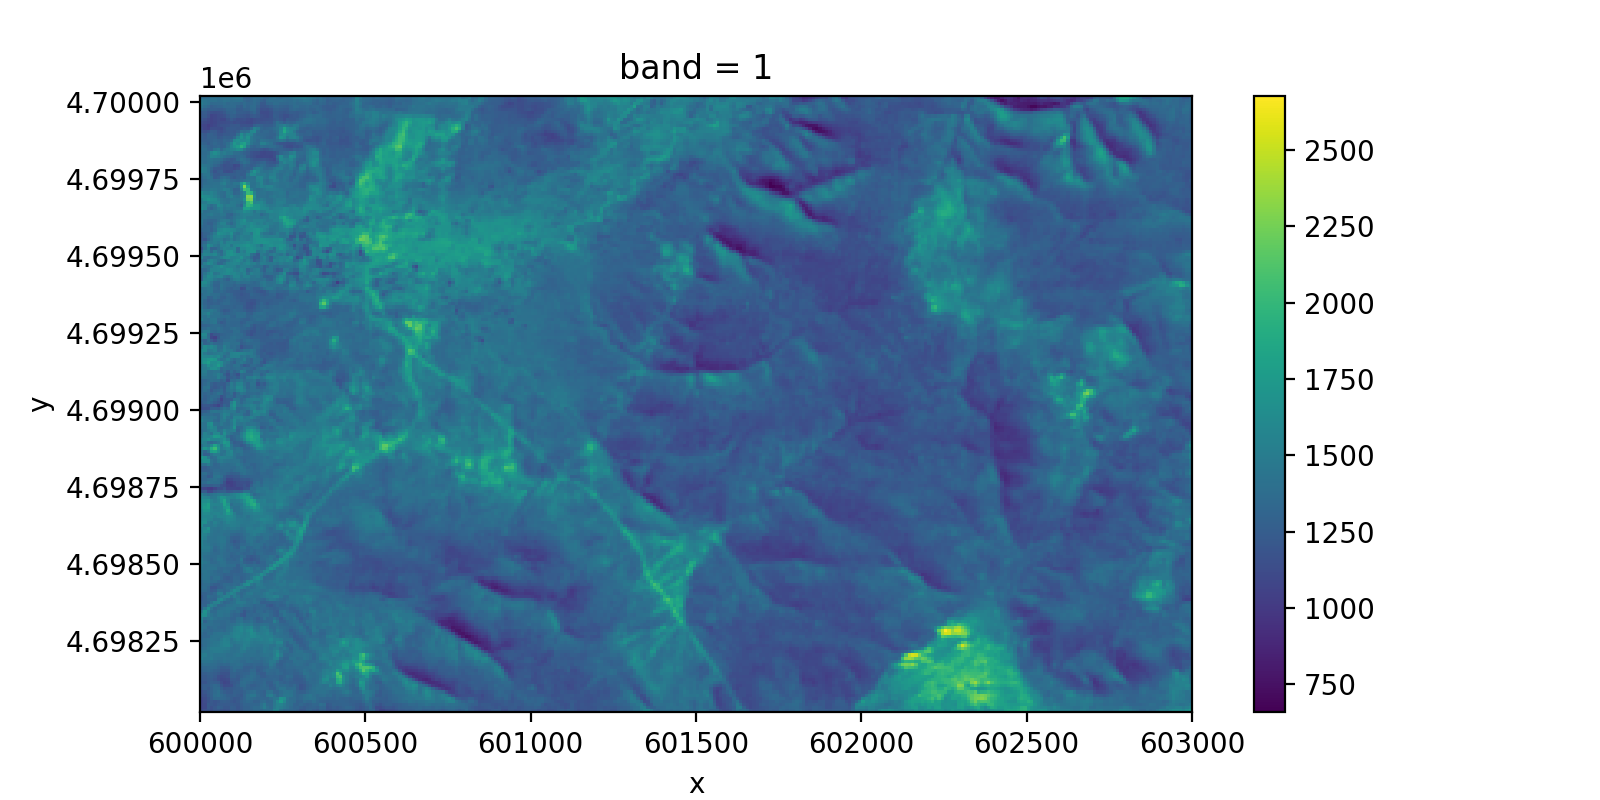
>>> from xrspatial.datasets import get_data
>>> data = get_data('sentinel-2')  # Open Example Data
>>> nir = data['NIR']
>>> red = data['Red']
>>> from xrspatial.multispectral import ndvi
>>> # Generate NDVI Aggregate Array
>>> ndvi_agg = ndvi(nir_agg=nir, red_agg=red)
>>> nir.plot(aspect=2, size=4)
>>> red.plot(aspect=2, size=4)
>>> ndvi_agg.plot(aspect=2, size=4)


>>> y1, x1, y2, x2 = 100, 100, 103, 104
>>> print(nir[y1:y2, x1:x2].data)
[[1519. 1504. 1530. 1589.]
 [1491. 1473. 1542. 1609.]
 [1479. 1461. 1592. 1653.]]
>>> print(red[y1:y2, x1:x2].data)
[[1327. 1329. 1363. 1392.]
 [1309. 1331. 1423. 1424.]
 [1293. 1337. 1455. 1414.]]
>>> print(ndvi_agg[y1:y2, x1:x2].data)
[[0.06746311 0.06177197 0.05772555 0.0660852 ]
 [0.065      0.05064194 0.04013491 0.06099571]
 [0.06709956 0.04431737 0.04496226 0.07792632]]